Heatmaps are familiar to anyone who builds websites, but there is a heatmap chart that is also extremely useful for trading crypto assets such as Bitcoin. That is “TradingLite.
I have actually used it and found it to be an excellent item, so I will introduce it to you. Seeing is believing, so please take a look at the following image.
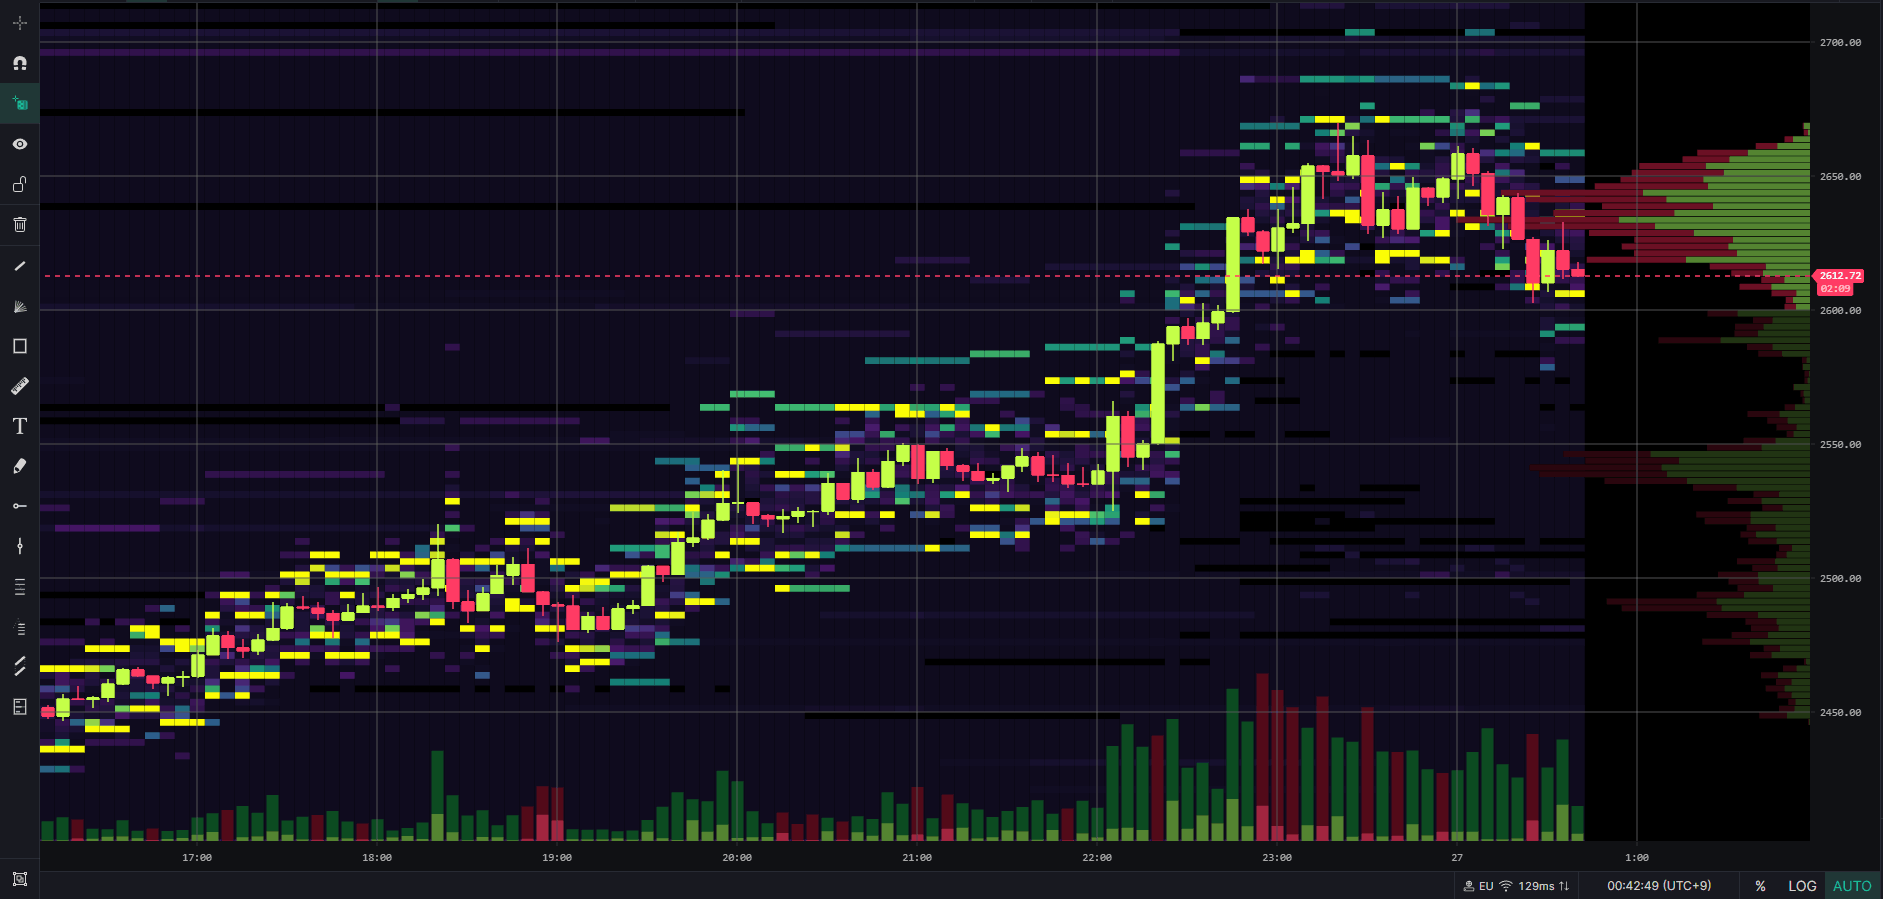
This changes color depending on the thickness of the board being put out. The yellow area is where the board is thicker. Even if it moves a little bit bigger, the board is rebounding nicely.
If you are reading this article, it probably goes without saying that the board is important.
On the right side of the image, the thickness of the trade in the price range is also visualized, which gives you an idea of where the price will land. Using the chart together with the information on the board makes it even more accurate.
The chart is used by top overseas traders, so it is very reliable.
The fee for using the service is about $12/month. (If you pay annually, it’s even cheaper.)
As you can see, if you’re tight on about $10, you’re probably not doing any trading, but if you take advantage of this Trading Light heat map, you’ll be well on your way to making enough to get a positive return right away. I’ve been keeping this open ever since I installed it.
Click here for more information on TradingLite (official website)
Please try to incorporate it into your trading successfully.